Pathology whole slide images for multimodal cancer research
By Charlotte Jennings, Samuel Barnett, Matthew Humphries, David Brettle, Darren Treanor onIn this blog we interview pathologists Professor Darren Treanor and Dr Charlotte Jennings, and scientists Professor David Brettle and Dr Matt Humphries at the National Pathology imaging Co-operative (NPIC).
NPIC have partnered with Genomics England to scan all the pathology slides associated with cancer participants of the 100,000 Genomes Project.1 This blog discusses the nuances of data quality and standards in digital pathology for machine learning research, and how whole slide images are being created for participants with cancer in the 100,000 Genomes Project.
First of all, could you give us an introduction to digital pathology?
In digital pathology, glass slides of tissue samples from patients are digitised into whole slide images (WSIs) which pathologists can view on computer screens to provide diagnostic, prognostic and predictive information for clinical care (Figure 1). Digital pathology has lots of clinical benefits, but the resultant WSIs also form a valuable data source which we can use for research.2,3

Figure 1. Digital Pathology. An overview of the workflow stages in digital pathology to generate a digital image from a patient tissue specimen. (Image icons created by Laura Valis)
How does getting this onto computers help with cancer research?
The size of WSIs (each image is 1.5GB) and the complexity of the information they contain makes them ideally suited to machine learning analyses, particularly when they're combined with other information such as clinical, genomic or radiological data (multimodal data).
The combination of pathology images and genomic sequence data, known as a pathogenomic approach to cancer research, has shown the ability to predict genomic features directly from the images and to improve classification tasks (such as predicting patient survival) compared with unimodal approaches.4,5 The potential for this research field is vast, however, progress is limited by the availability and volume of high-quality data.
Why is data quality such a challenge? It sounds like it’s not quite as simple as taking pictures of slides...
In each stage of preparing a WSI, variation can be introduced in a number of ways, any of which may impact the final image. This might be due to the way the tissue is fixed and processed in the lab, the reagents and protocols used to stain the tissue, or the instruments and materials that make up the slide. In digital pathology, there are additional factors of how the image is made, which can vary according to scanner type and setting (such as resolution, colour profile, image compression).
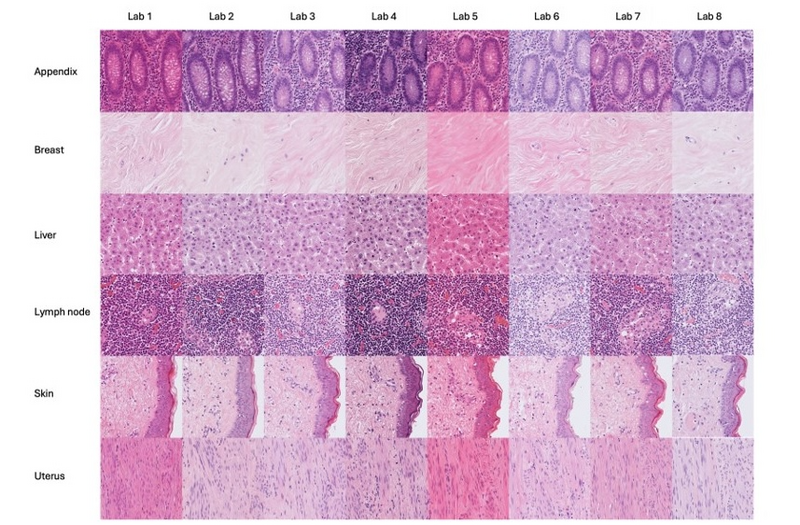
Figure 2. Histological H&E stain variation. Example of visual stain difference in whole slide images of slides prepared at different laboratories. Unstained tissue sections form the same blocks of tissue were sent to different laboratories for staining. (Images provided by Catriona Dunn; Leeds Teaching Hospitals NHS Trust, University of Leeds.)
Humans are naturally adept at coping with this sort of variation, and so while many of these variable factors have existed for decades, the drive to reduce variation and create standards was lacking.
Machine learning is not as resilient to variation as we are, and any false correlations made in training data can affect the model's performance. Data with different technical image variation (often as a result of being produced at different labs) can become incorrectly associated with biological factors (such as survival) – this is termed a “batch effect” (Figure 2).
For example, in a training set, if images from hospital A = good outcome, while images from hospital B = poorer outcome, when future images are encountered which look like a hospital B image, a poorer outcome will be predicted by the model irrespective of the actual features in the patient data.
AI models are often trained on highly curated datasets and suffer significant performance loss when applied to real-world data with all of its variability. To get around the variability, we could use extremely large datasets with every type of image to ensure the thresholds are more generalisable, however, this will take significant time and resources, and we may still struggle with outliers where relevant important image information is simply not present.
In the short-term, more pragmatic approaches to mitigate these batch effects such as colour normalisation/augmentation and data partitioning are commonly used by researchers.6,7
The longer-term solution to these data issues is improving the consistency of histopathology slides at source through the development of clear standards and objective measures of quality.
In NPIC, you have a quality focussed work stream - where do you see the priorities?
We believe that we need quality processes at every stage in the digital pathology image chain, starting with tissue fixation through to digitisation, and even display. This is because the variation at each stage can be compounded upon, and many of these variations cannot be compensated for later. Our current priorities at the NPIC Quality Coordination Centre are effectively the low hanging fruit: stain variability, scanner colour reproduction, and display. Our goal is to develop tools in these areas to allow the variability to be measured, and where required, standards can then be applied.
What methods are you using for assessing quality, presumably there isn’t just one approach?
To quantify stain variation caused by the staining process, we currently have a stain assessment tool called 'Tango'.8 “H&E” is the main stain used in diagnostic pathology and is responsible for the pink-purple images you may have seen. It is combination stain of two reagents, Haematoxylin (blue-purple) and Eosin (pink) , which highlight different parts of the cells and tissues for easier assessment.
Tango is a biopolymer label on a slide. The biopolymer is of a known thickness and responds linearly to stain variation. This allows us to include a Tango slide periodically in the rack with clinical slides, for example 2, 3 or 4 times a day, and allows us to measure stain intensity variation. We can also split the colours of the image to determine whether any variation is due to variation in either Haematoxylin or Eosin.
Figure 3. shows the current variation measured in 8 laboratories across a 10-day period. The advantage of Tango is not only that it can be used to set a target level for stain variability, but also, we believe having an optimum target level allows for stain optimisation, ultimately reducing reagent changes or recutting/staining. Reducing the volume of re-staining saves not just time, but also cost and environmental impact of increased reagent use.
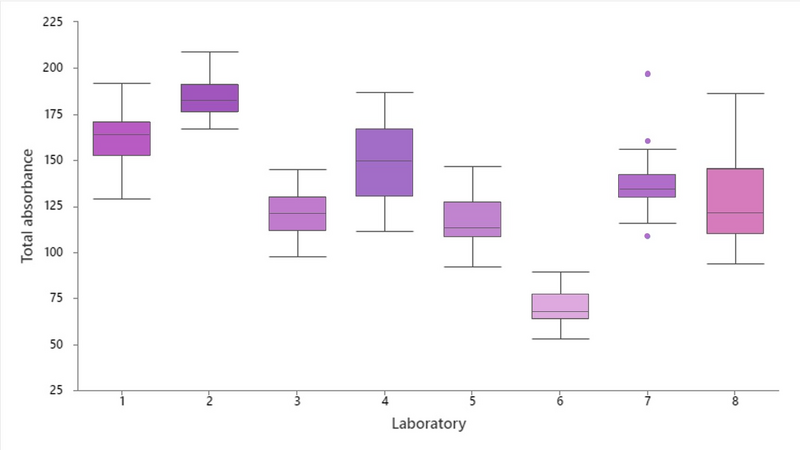
Figure 3. H&E stain variation measured by Tango. The boxplots show stain variation in 8 UK laboratories over a 10-day period as measured by the Tango quality slide. The colour of the boxes is a visual representation of the represent the medium colour values measured at each lab (Images provided by Catriona Dunn; Leeds Teaching Hospitals NHS Trust, University of Leeds.)
To measure the scanner colour we are using the Sierra slide from FFEi, which we helped develop with FFEi.9 This tool has around 50 colour patches on it to allow the scanner colour space to be characterised (Figure 4).
The one main advantage of Sierra is that the colour patches are made from real histological stains, and as such, any colour effects in the scanner e.g., metamerism (where a colour can look different depending on the illumination) are still indicative of real-world impact. The Sierra slide allows an ICC colour profile to be determined, which can reduce colour variability between scanners and can even be applied down the line on the display or embedded into the WSI header file. We use Sierra as a simple colour reference test that allows us to do periodic scanner comparisons along with reference tissue, to ensure the scanner is performing consistently.
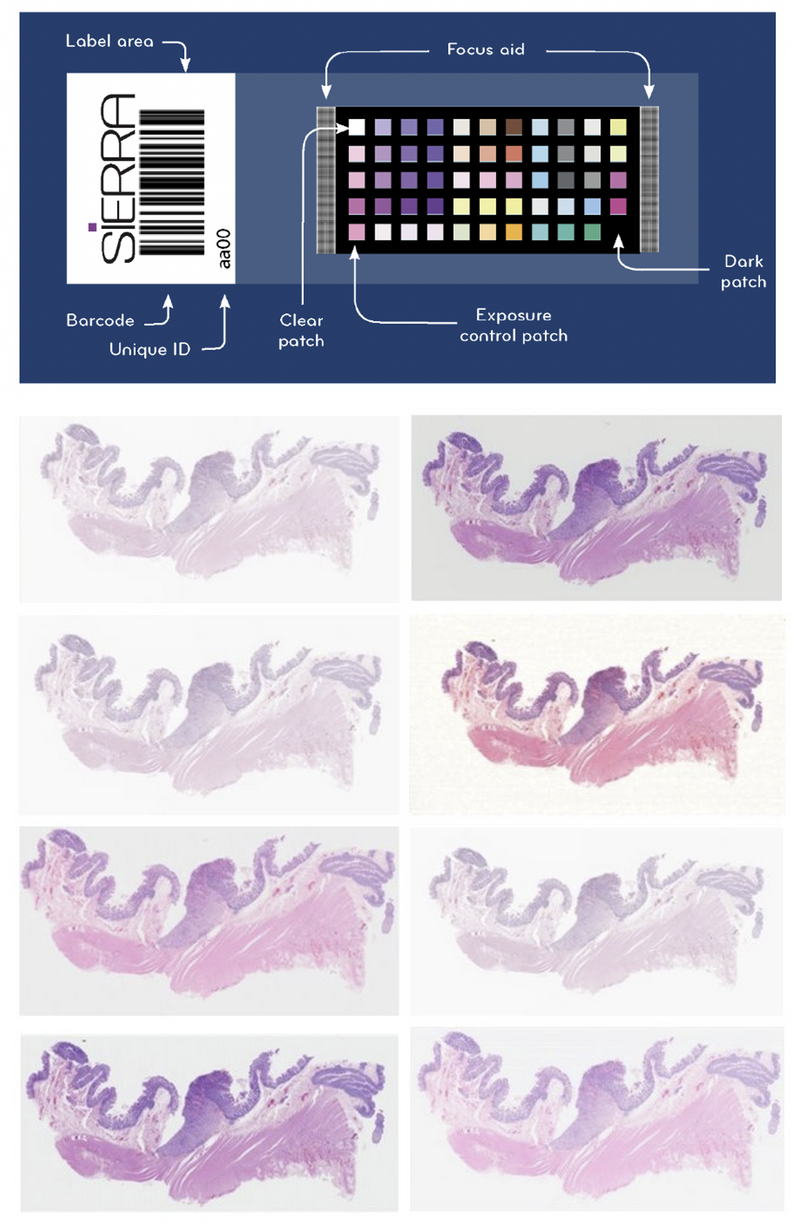
Figure 4. Sierra slide for scanner colour calibration. The standardised colour patches on the Sierra slide are compared with the colour output in the scanned image to understand variability in colour reproducibility by scanners. With repeat assessments, the performance of an individual scanner can also be monitored. Below is an example of the variation introduced by different scanners – the same slide has been scanned across 8 different platforms in the NPIC FORGE.
The display is an area where we believe there is still significant confusion and variability. This last stage, from the display to the observer, is what we call the 'photon yard’, and it is sensitive to variation in the display, ambient lighting, and the visual acuity of the observer. It can have a disproportionate impact on perceived image quality.
To help with this, we have developed a free online tool called POUQA (Point of Use QA).10 This tool presents 4 low contrast random letters to the observer (Figure 5). These letters and the background are all in the H&E colour space, so if you can repeat the letters successfully, we have some confidence the photon yard is meeting the minimum requirements for viewing H&E images.
It is important to note that this test does not replace the need for proper display QC. But it is interesting to know that since this tool has gone live in 2020, it has been used over 5000 times and there is currently a 7% failure rate. This is after we have corrected the data to include only validated tests used by practicing pathologists.
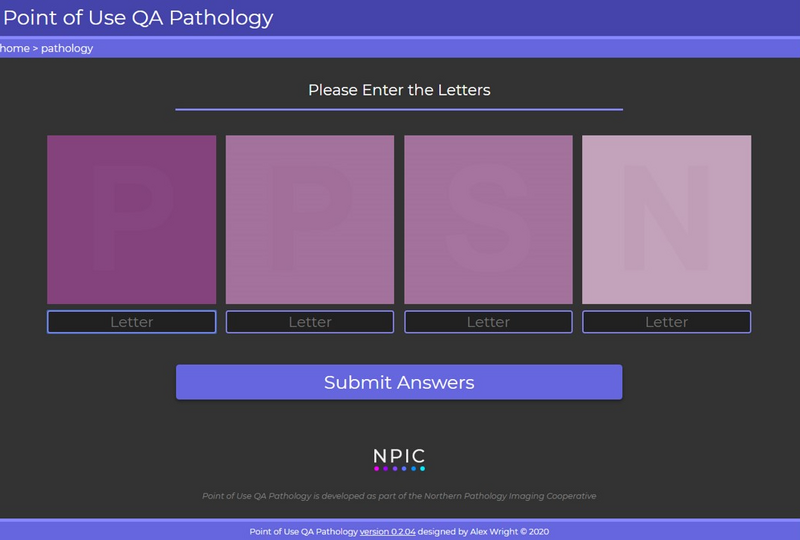
Figure 5. The point of use quality assurance (POUQA) tool. The tool requires the user to correctly identify the letters within the four squares to verify the minimum levels of contrast can be detected to view pathology images. The tool is publicly available at https://www.virtualpathology.l...
Colour is clearly an important part of WSI quality, can you tell us about other challenges?
There are many dimensions to image quality, and another we are vigilant about is the presence of artefacts which can appear in the image. These may arise due to tissue handling and laboratory processes in the slide creation, as a result of use and storage of the slide or due to scanning errors.
At our unique multi-scanner facility (NPIC-FORGE), we are able to control and monitor our scanning equipment beyond usual clinical operating standards.11 Quality assurance (QA) and quality control (QC) are central to the creation of high-quality images. Each image generated is manually evaluated by a member of our trained team as part of our consistent QC process (Figure 6). This ensures that images are as free as possible from errors which may influence AI algorithm training.
Images which fail QC (e.g., image tiling or banding, debris on slide, excess mountant on slide, poor image focus) are separately retained and categorised, as they represent a useful source of AI training data in their own right. Image QC is supported by robust quality monitoring steps, including the regular scanning of histological controls and in-house developed test objects. These controls provide an objective ground truth which enables longitudinal image comparison.
In parallel with the QC of images produced, are the QA processes for each piece of scanning equipment. Settings are confirmed and recorded for WSI systems, including the compression type and quality, as well as the ICC profiles. This is in addition to the manufacturers care and maintenance instructions and annual service arrangements.
Finally, the FORGE can support the development of robust datasets by replication scanning across our many different scanning platforms – effectively introducing scanning variability into the images but in a controlled and interpretable way.
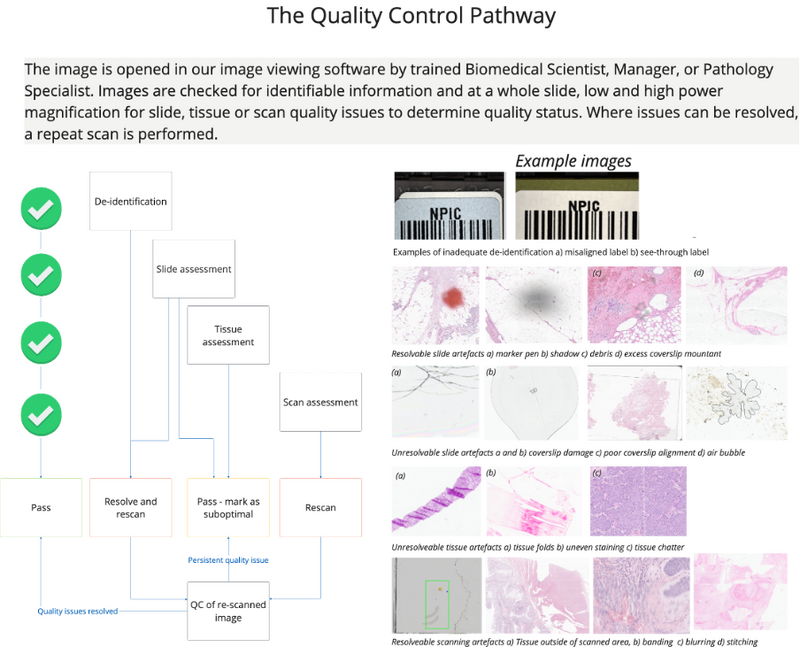
Figure 6. Image quality control. The quality control pathway simplified from standard operating procedures at the NPIC FORGE facility. The process is designed to identify issues which can be resolved to generate the best possible quality images.
How have you been translating this work to help digitise the 100,000 Genomes Project?
This NPIC experience has been used to guide our approach in generating the WSIs for the 100,000 Genomes Project. It is important that researchers understand how the resource was created to assess its suitability for a particular research use case, and to understand the limitations of any findings.
This is a retrospectively scanned dataset, with slides expected to be contributed from 84 NHS sites by the end of the project. The image resource will have the inherent variability introduced by the physical processes of slide preparation across multiple laboratories.
Once the slides are received at the NPIC scanning facility, they are cleaned and de-identified prior to scanning. All of the slides will be scanned on the same clinical grade scanning platform (Leica GT450 DX) at 40x equivalent magnification (0.26 mm/pixel) to control any variability introduced by different scanning platforms.
A sub-cohort will be scanned across the multiple scanning platforms at NPIC’s multi-scanner facility – this will enable researchers to develop and test their models across multiple platforms in a way that is interpretable. The images of this project will be subject to all of the standard NPIC quality control and quality assurance checks outlined above. Where quality issues cannot be resolved, usually due to slide damage or tissue-based artefacts, the images are flagged as suboptimal.
We hope that this research dataset will be valuable to many researchers in years to come, and are very proud to be putting quality at the forefront. Multimodal research introduces technical challenges for machine learning, but an additional challenge for researchers is comprehensively understanding the pitfalls and intricacies of this type of data. We’re invested in high-quality cancer research so we’re keen to help share our knowledge.
Great, thank you for answering our questions! I look forward to hearing about the progress in digital pathology you are making in the future!
If you want to find out more about the work happening at Genomics England, check out our other research blogs. Or, listen to our Genomics 101 podcast: What is multimodal data?
Reference materials
- Jennings, C. N., Humphries, M. P., Wood, S., Jadhav, M., Chabra, R., Brown, C., Chan, G., Kaye, D., Bansal, D., Colquhoun, C., Merzouki, N., Arumugam, P., Westhead, D. R., & Treanor, D. (2022). Bridging the gap with the UK Genomics Pathology Imaging Collection. Nature Medicine, 28(6). https://doi.org/10.1038/s41591...;
- Williams, B. J., Bottoms, D., Clark, D., & Treanor, D. (2019). Future-proofing pathology part 2: building a business case for digital pathology. Journal of Clinical Pathology, 72(3), 198–205. https://doi.org/10.1136/jclinpath-2017-204926
- Williams, B. J., Bottoms, D., Clark, D., & Treanor, D. (2019). Future-proofing pathology part 2: building a business case for digital pathology. Journal of Clinical Pathology, 72(3), 198–205. https://doi.org/10.1136/jclinpath-2017-204926
- Cifci, D., Foersch, S., & Kather, J. N. (2022). Artificial intelligence to identify genetic alterations in conventional histopathology. The Journal of Pathology, 257(4), 430–444. https://doi.org/10.1002/path.5898
- Schneider, L., Laiouar-Pedari, S., Kuntz, S., Krieghoff-Henning, E., Hekler, A., Kather, J. N., Gaiser, T., Fröhling, S., & Brinker, T. J. (2022). Integration of deep learning-based image analysis and genomic data in cancer pathology: A systematic review. European Journal of Cancer (Oxford, England : 1990), 160, 80–91. https://doi.org/10.1016/j.ejca...;
- Howard, F. M., Dolezal, J., Kochanny, S., Schulte, J., Chen, H., Heij, L., Huo, D., Nanda, R., Olopade, O. I., Kather, J. N., Cipriani, N., Grossman, R. L., & Pearson, A. T. (2021). The impact of site-specific digital histology signatures on deep learning model accuracy and bias. Nature Communications, 12(1), 4423. https://doi.org/10.1038/s41467...;
- Fan, F., Martinez, G., Desilvio, T., Shin, J., Chen, Y., Wang, B., Ozeki, T., Lafarge, M. W., Koelzer, V. H., Barisoni, L., Madabhushi, A., Viswanath, S. E., & Janowczyk, A. (2023). CohortFinder: an open-source tool for data-driven partitioning of biomedical image cohorts to yield robust machine learning models.
- Dunn, C., Brettle, D., Cockroft, M., Keating, E., Revie, C., & Treanor, D. (2024). Quantitative assessment of H&E staining for pathology: development and clinical evaluation of a novel system. Diagnostic Pathology, 19(1), 42. https://doi.org/10.1186/s13000...;
- Clarke, E. L., Revie, C., Brettle, D., Shires, M., Jackson, P., Cochrane, R., Wilson, R., Mello‐Thoms, C., & Treanor, D. (2018). Development of a novel tissue‐mimicking color calibration slide for digital microscopy. Color Research & Application, 43(2), 184–197. https://doi.org/10.1002/col.22187
- Wright, A. I., Clarke, E. L., Dunn, C. M., Williams, B. J., Treanor, D. E., & Brettle, D. S. (2020). A Point-of-Use Quality Assurance Tool for Digital Pathology Remote Working. Journal of Pathology Informatics, 11(1), 17. https://doi.org/10.4103/jpi.jp...;
- Humphries, M., Kaye, D., Stankeviciute, G., Halliwell, J., Wright, A., Bansal, D., Brettle, D., & Treanor, D. (2023). Development of a multi-scanner facility for data acquisition for digital pathology artificial intelligence. Medrxiv. https://doi.org/https://doi.or...;


