100,000 Genomes Project: Exploring the diagnosis of rare conditions in the context of genetic ancestry
By Samuel Tallman onSam Tallman, Genomics Data Scientist – Diverse Data, Dr Maxine Mackintosh, Programme Lead - Diverse Data, Prof Karoline Kuchenbaecker, Scientific Lead - Diverse Data, Loukas Moutsianas, Head of Bioinformatics Research Services, all at Genomics England.
Sam Tallman has a background in studying the genetics of under-represented populations. His main research interests are geared towards understanding the global structure of human genetic diversity, and how this knowledge may help us to learn about our collective history and improve healthcare outcomes for everyone.
In this blog piece, Sam Tallman summarises the key findings from our first analysis into participant diversity across the iconic founding initiative of Genomics England, the 100,000 Genomes Project. Focusing on participants with rare conditions and the small variant tiering pipeline, (which uses Genomics England’s PanelApp to prioritise variants for the discovery of genetic diagnoses), he investigates whether a participant’s predicted ancestry is associated with differences in diagnostic outcomes. He then goes on to discuss the potential causes of any observed differences.
Introduction
Genomics has a diversity problem.
When taken together, over 90% of sequenced genomes are from people of European descent, and this disparity is growing.
As a result, almost everything we know about genomic medicine is from research into a small number of largely ancestrally homogenous, European populations - populations that make up a mere 16% of the global whole and an even smaller fraction of human genetic diversity.
The consequences of imbalanced datasets and research focuses are already being felt. Missed or incorrect diagnoses, lower predictive accuracy, and poorer understanding of a variety of conditions have been consistently reported in patients from under-represented and genetically diverse communities. A recent study of the Deciphering Developmental Disorders (DDD) cohort found lower diagnostic accuracy for participants of African ancestry with highly penetrant neurodevelopmental disorders relative to those with European ancestry. This suggests that imbalanced datasets may also be influencing the diagnosis of rare conditions. In 2021, the Genomics England Diverse Data initiative was established with the goal of reducing inequalities within genomic medicine through engagement, research, clinical translation and addressing imbalances in genomic data. An essential early step to achieve these goals is understanding where and how diversity (or lack thereof) of participants in genomic studies may play a role in the diagnostic gap.
In this blog, we summarise the key findings from an initial analysis of participant diversity and outcomes from the 100,000 Genomes Project. Focusing on participants with rare conditions, we investigate whether inferred genetic ancestry is correlated with diagnostic outcomes or numbers of prioritised candidate variants. We find little or no difference in the overall rates of diagnosis for a rare condition across genetically-assigned groups. We do, however, observe modest differences in rates of diagnosis when restricting analysis by family structures or modes of inheritance. Furthermore, we find clear differences in the numbers of reported candidate variants across genetically assigned groups, with European assigned participants having fewer reported candidate variants than African, South Asian, or East Asian assigned participants.
Genetic diversity of the 100,000 Genomes Project rare disease cohort
Defined as disorders that affect less than one in every 2,000 births, rare conditions collectively affect 6% of the UK’s total population (over 4 million people).
Of the approximately 10,000 rare conditions that have been characterised worldwide, more than 80% are estimated to be genetic. Despite this, over 50% of cases in the UK remain undiagnosed.
As one of two major groups recruited to the 100,000 Genomes Project (the other being cancer participants), NHS patients with a broad spectrum of undiagnosed rare conditions make up 37.8% (n = 34,082) of all whole genome sequenced (WGS) participants, with a further 43.1% (n = 38,864) made up of both affected and unaffected family members.
The major objective of sequencing the genomes of these participants is to allow identification of disease-causing variation – differences in their DNA that are often extremely rare in the population or unique to a family. Usefully, these genetic variants can also be used to paint a picture of the participant’s genetic ancestry.
Principal components analysis (PCA) is a method commonly used for this purpose (Figure 1a). By projecting the participants from our rare disease cohort on principle components with that calculated using data from a diverse selection of reference populations, it is possible to infer where in the world a participant’s genetic ancestors are likely to be from, and in turn, assign them into groups across which we can then compare across a range of statistics.
Across the rare disease cohort of the 100,000 Genomes Project, we observe that most participants appear genetically most closely related to Europeans (EUR, 79.5%), suggesting many of their recent ancestors lived in Europe. Those assigned to the South Asian (SAS, 10%) and African populations (AFR, 3.9%) are the second and third most frequently observed respectively, whilst those assigned to the East Asian (EAS) population make up as little as 0.6% of the dataset.
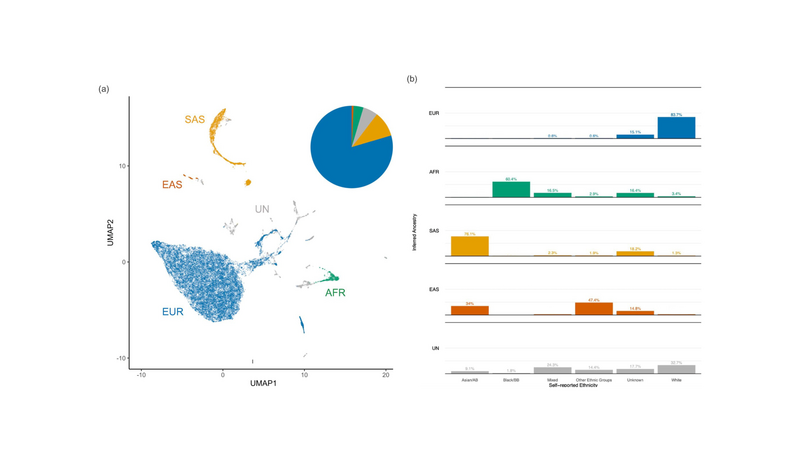
Figure 1. Genetic diversity of the 100,000 Genomes Project rare disease cohort. (a) Uniform manifold approximation and projection (UMAP) plot of 31,222 rare disease probands from the 100,000 Genomes Project. Pie chart shows proportions of individuals assigned to each group using random forest classification (with probability P>0.8) trained on the top eight PCs of continental reference populations from the 1,000 Genomes Project Phase III. Individuals with (>0.8) assignment to the Admixed American (AMR) population were included as unassigned (UN) (owing to the heterogeneous ancestry present among individuals within this reference group) along with individuals with <0.8 assignment to any one reference population. (b) Broad, self-reported ethnicity (ONS 2001) of participants assigned to each of the four super populations or otherwise unassigned. Exact percentages of groups with low (<5) sample are masked to preserve participant privacy. EUR = European, AFR = African, SAS = South Asian, EAS = East Asian, UN = Unassigned. Asian/AB = Asian or Asian British. Black/BB = Black or Black British. Unknown ethnic groups include individuals whose self-reported ethnicity was either missing, not known, or not stated.
Based on the concordance between each participant’s self-reported ethnicity and their population assignment (Figure 1b), these estimates seem to be in line with expectations from recent ONS demographic surveys. That is, no one ethnic group in the UK appears to be clearly under-represented in the 100,000 Genomes Project rare disease cohort under the expectations of representative sampling.
Effect of a participant’s genetic ancestry on their likelihood of receiving a diagnosis
In a nutshell, the approach of the 100,000 Genomes Project to informing clinical rare condition diagnosis begins with an automated, multi-step genomic variant calling and interpretation pipeline. One key output of this pipeline is a list of “tiered” single nucleotide variants (SNVs) and small insertions or deletions (INDELs), collectively termed here as “small variants”.
The pipeline ranks small variants called across each participant into 'tiers' of plausibility of causing condiitons by applying stepwise criteria. These criteria are based on the types of things we know usually make a variant a good candidate for being involved in a severe, early-onset, rare condition. Tier 3 denotes the lowest priority candidates, whilst Tier 1 denotes the highest priority candidates. These candidate variants are then returned to the NHS clinical scientists in charge of a participant’s case for a full clinical review and evaluation.
To look for differences in diagnostic outcomes resulting from the rare condition small variant tiering pipeline, we plugged each participant’s population assignment into multi-variate generalised linear models (GLM), alongside additional variables which are also likely to effect variant tiering and diagnostic yield.
The results of this modelling can be found in Figure 2.
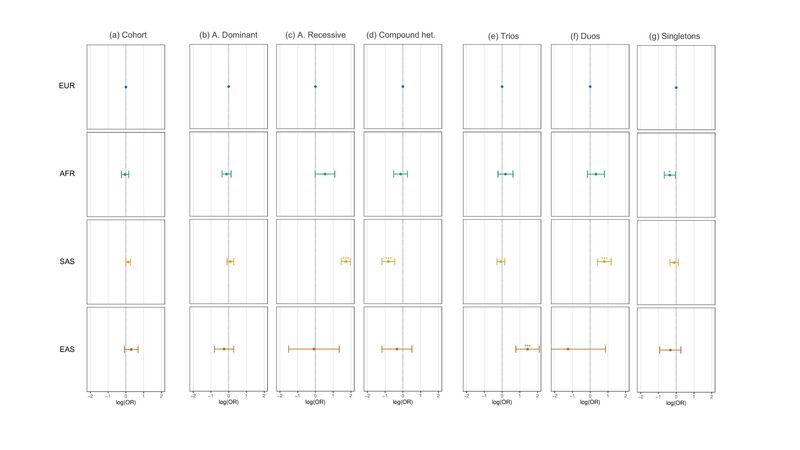
Figure 2. Association of population assignment with diagnostic yield assessed using multivariate regression. (a) Association between each ancestry group with case solve rate (diagnostic yield) of Tier 1, Tier 2, or Tier 3 variants relative to EUR assessed using logistic regression across the entire rare disease cohort. (b-d) As in (a) but (b) using only diagnostic tiered variants that passed the autosomal dominant segregation pattern filter (c) the autosomal recessive segregation pattern filter (d) the compound heterozygous segregation pattern filter. (e-g) As in (a) but for (e) only probands recruited as full parent-offspring trios (f) parent-offspring duos (g) singleton probands. Models were adjusted for covariates: PanelApp version applied, number of PanelApp versions applied, family structure, penetrance, consanguinity, sex, age at recruitment, handling GMC trust, and sample source (blood, saliva etc.) by including each term in the model, including the interaction between family structure and penetrance or population assignment. OR = Odds Ratio. * p value < 0.05 > 0.01. ** p-value < 0.01 > 0.001. *** p-value < 0.001. Unassigned individuals, individuals that were not evaluated using the tiering pipeline, as well as individuals with close familial relatives (>3rd degree) in the cohort were excluded.
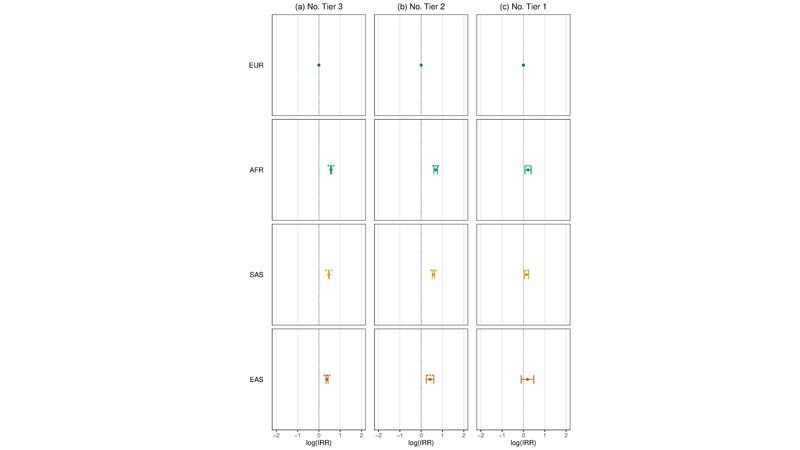
Figure 3. Association of ancestry assignment with variant tiering assessed using multivariate regression. (a) Association between each ancestry group with the number of Tier 3 variants per rare condition proband relative to EUR (European) assessed using negative binomial regression modelling. (b) As in (a) but for Tier 2 variants (c) As in (a) but for Tier 1 variants. IRR = incidence risk ratio. Models were adjusted for covariates: sex, PanelApp version applied, number of PanelApp versions applied, family structure, penetrance, consanguinity, and sample source (blood, saliva etc.) by including each term in the model, including the interaction between family group type and penetrance. * 0.05<p-value < 0.01. *** > 0.001 <p-value < 0.01. *** p-value < 0.001. Unassigned individuals, individuals that were not evaluated using the tiering pipeline, as well as individuals with close familial relatives (>3rd degree) in the cohort were excluded.
At first glance, we observe that an individual’s population assignment is associated with little difference in their overall odds of receiving a diagnosis using tiered SNVs and INDELs identified throughout the project (Figure 2a).
If we dig a bit deeper, however – some notable differences do become apparent.
One such difference is in the kinds of variants that are being identified as diagnostic across populations. Participants assigned to the South Asian population, for example, had a significantly higher rate of conditions being diagnosed using autosomal recessive tiered variants (Figure 2c) – a result likely linked to increased endogamy and runs of homozygosity (ROH) among groups such as British Pakistanis.
Another difference appears when segregating the dataset by sequenced family structure. That is, the family members that were recruited alongside the proband (participant with the condition of interest). When restricting the analysis to probands recruited alone (singletons), African-assigned participants appeared to have modestly reduced odds of receiving a diagnosis relative to European-assigned participants (Figure 2g). Such findings align with the results reported in a recent analysis of the Deciphering Developmental Disorders (DDD) cohort but across a more heterogeneous set of genetic conditions. However, when restricting the dataset to either parent-offspring trios (Figure 2e) or duos (Figure 2f), no difference in diagnostic yield is observed between African and European-assigned participants, whilst East Asian and South Asian-assigned participants appear to have increased odds of receiving a diagnosis over Europeans, respectively.
Reference datasets being ancestrally-imbalanced impacts variant prioritisation
Observed variation in the rates of recessive conditions across human populations is expected given differences in their relative cultural and demographic histories, however, associations between a participant’s genetically inferred ancestry and variation in their overall likelihood of receiving a diagnosis may be the result of several factors.
Factors that may potentially affect diagnosis can occur at all stages of the diagnostic process: from presentation at the clinic, to phenotyping, and interpretation of diagnostic reports. One such factor that is easier to quantify is reflected in the number of variants being tiered by the rare condition small variant pipeline (Figure 3).
What we can see in Figure 3, is that across the 100,000 Genomes Project rare disease cohort, European-assigned participants are modelled as having fewer Tier 3 (Figure 3a), Tier 2 (Figure 3b), and Tier 1 (Figure 3c) variants identified on average than participants assigned to any other population after adjusting for covariates.
So, what is happening here?
Well, one important factor to consider is one often deemed essential for determining if a variant is a good candidate for being the cause of a rare condition: a variant’s frequency in the population.
This makes sense. For variants to cause severe, early-onset, rare conditions that the small variant tiering pipeline is configured to assess, they should – in most instances – be rare. To account for this fact, the pipeline applies a filtering step which excludes variants from being tiered if they are observed above a given frequency across a selection of reference datasets.
Whilst this sounds simple enough, such a step can be a source of significant bias. This is because in practice, a variant’s observed frequency depends greatly on the sampling frame.
Human populations have evolved independently for up to thousands of generations. As such, the frequency of a variant across populations can differ substantially. To mitigate selection bias when assessing the validity of a candidate variant based on its estimated frequency, it is essential to sample reference datasets from the most genetically diverse selection of populations possible.
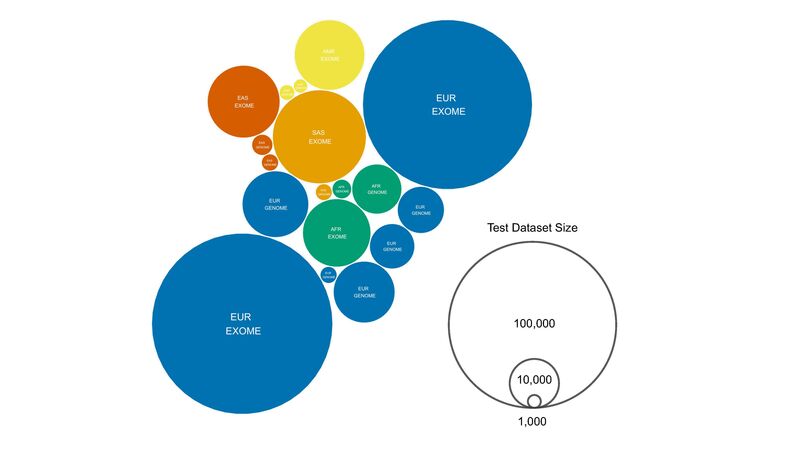
Figure 4. Inferred ancestry and size of the test datasets used to assess allele frequency as part of the SNV and short INDEL tiering pipeline. EXOME includes exome sequencing data only. GENOME includes whole genome sequencing datasets. Exonic variants are assessed using both exome and genome test datasets. Variants not captured through exome sequencing would only be tested using genomic datasets by default. Ancestry labels are taken from those given by the relevant datasets (e.g. gnomAD) or inferred based on the test datasets (UK10K = EUR, DiscovEHR = EUR). Test dataset size is in total number of haplotypes (two haplotypes per diploid individual).
When looking at the reference datasets used to determine variant frequency as part of the 100,000 Genomes Project – visualised in Figure 4 – the persistence of imbalanced sampling endemic to human genomics research becomes apparent. Compared to the over 125,000 sampled Europeans among seven reference datasets, all other populations combined are represented by less than 50,000 individuals, 2.5x fewer.
To demonstrate the effect that imbalanced sampling can have on variant tiering, we simulated thousands of iterations of the pipeline’s variant filtration step across a broad range of population-specific frequencies, parametrised simply by the size and number of the reference datasets and their respective filtration thresholds (Figure 6a/b).
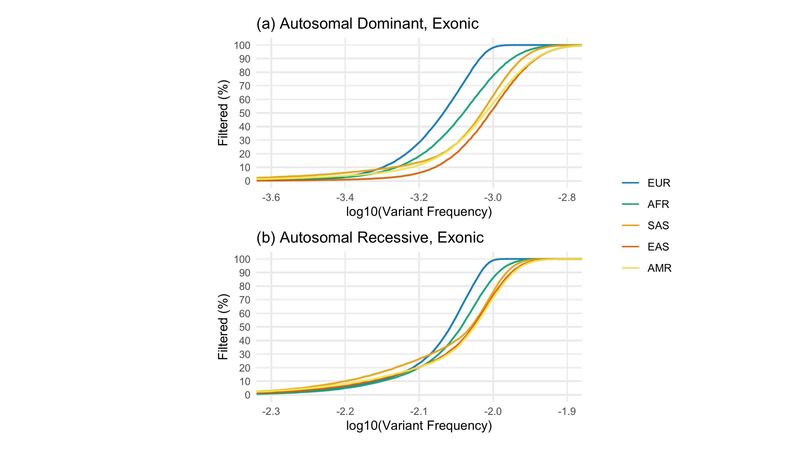
Figure 5. Simulated outcomes of the SNV and short INDEL tiering allele frequency filtration step per population. (a) Proportion of 100,000 simulated exonic variants at each true, variant frequency (in steps of 0.001%) in each population that were filtered based on the autosomal dominant filtration thresholds for each test dataset, including exome and whole genome sequences (Figure 4). That is, for example, the likelihood of filtering each simulated variant given the number, size, and threshold of EUR datasets is entirely independent of non-EUR datasets, as in the case of private/population-specific variants (b) As in (a) but for autosomal recessive exonic variants.
From this, we can see that for all but the rarest of variants, if a variant called in a participant truly appears at a given frequency in the European (EUR) population, the likelihood it will be filtered by the small variant pipeline is greater than if it appears at that same frequency in any other population (Figure 5a/b). This is particularly relevant for the removal of variants specific to a particular population (these are what is being simulated in Figure 5)).
As a result, without even having to consider differences in sub-continental population structure and variant frequency spectra across continental populations, we can see that Genomics England 100,000 Genomes Project participants with ancestry from Europe will be expected to end up with fewer variants being sent to clinicians for review – a potential source of bias when assessing participants with genetic ancestry from outside of Europe.
Key takeaways and next steps
In this blog, we have provided a snapshot summary of the Diverse Data Initiative’s first analysis of the 100,000 Genomes Project rare disease cohort. We report several novel insights concerning variation in diagnostic outcomes resulting from Genomics England’s small variant tiering pipeline. Below are some of the key takeaways.
As expected, the rare disease cohort of the 100,000 Genomes Project is largely made up of individuals of European ancestry (79.5%) (Figure 1). However, the genetic diversity of the UK population means thousands of participants recruited as part of the programme derive ancestry from non-European populations, enabling comparisons to be made across continental ancestry groups.
Using such comparisons, our modelling suggests that modest differences in current diagnostic yield exist among certain participant groups with respect to their inferred genetic ancestry. Even though it appears that the genetic ancestry of rare condition participants has played a relatively minor role in their overall likelihood of receiving a diagnosis (Figure 2a), we do observe that singleton participants with sub-Saharan African ancestry for example, were less likely to receive a diagnosis than European-assigned singletons (Figure 2e). Missing diversity and imbalanced sampling of reference datasets used to determine variant rarity is a potential source of this bias (Figure 4/5). Indeed, diversity across many African populations remains broadly uncatalogued across available reference databases.
Whilst further analysis is required to fully understand the relationship between diagnostic yield and imbalanced reference datasets, it is plausible that the reduced precision with which variants more common in non-European populations can be filtered by the pipeline – especially among singleton participants – and the likely increase in the number of reported variants of uncertain clinical significance (VUS) can impact the odds that a tiered variant will be subsequently accepted as diagnostic (Figure 2e). Given the elevated genetic diversity and relative divergence of populations from sub-Saharan Africa versus Europe and the rest of the world, greater numbers of tiered variants would be expected to be reported for African-assigned participants even if balanced references datasets were available. As such, participants with African or African-derived ancestry may be especially affected by the lack of candidate variant filtration stringency afforded to singleton probands relative to those recruited alongside close family members. We anticipate that such findings will also be relevant for future initiatives led by Genomics England, such as the Newborn Genomes Programme, where singletons will account for the majority of recruited participants.
Several caveats should also be noted, however.
Importantly, the current reference populations used to group participants using genetic data (Figure 1) are by no means exhaustive, and may mask any effects at a finer-scale population structure, or on groups of recent or historic admixture (note the large numbers of “unassigned” participants (Figure 1a)).
Further, unmodelled covariates may also greatly influence variation in diagnostic yield. Shared socio-cultural environment, behaviour, and other variables that are correlated with population assignment should be carefully considered before attributing differences in diagnostic outcomes to patterns of genetic variation resulting from shared ancestry. Why East Asian assigned trios (Figure 2e) or South Asian assigned duos (Figure 2f) appear to have comparatively high rates of diagnosis, for example, warrants further investigations to understand. More fine-grained ancestry inference and collection of additional linked participant data could help us investigate further in future iterations of this work.
Finally – but critically – diagnostic evaluation of participants in the 100,000 Genomes Project remains an ongoing process. Analysis of complex variant types such as copy number variation (CNVs) and short tandem repeats (STRs), application and development of additional diagnostic discovery methods, and research from academic and industry partnerships, continues to increase the number of diagnoses across the cohort. We emphasise that any reference to diagnostic yield in this blog must therefore be considered as both preliminary, and in reference to diagnoses resulting from the outputs of the small variant tiering pipeline alone. Future analyses will assess inter-population differences across specific diseases, variant types, and a greater variety of diagnostic approaches, including those developed for the analysis complex traits such as polygenic risk scores (PRS).
To conclude, initiatives such as the 100,000 Genomes Project have played a central role in leveraging the power of genomics medicine, providing diagnoses for thousands of rare condition participants across the UK. The advent of the NHS Genomics Medicine Service (GMS) has ensured that these advances will continue to be integrated into routine clinical practice.
As the UK continues to grow more diverse, it is essential to ensure that genomic medicine works equally well for everyone, regardless of their genetic ancestry. Potential differences in diagnostic accuracy among certain participant groups in the 100,000 Genomes Project is yet more evidence that genomic medicine must rapidly shift its focus towards a diversity agenda. Initiatives – both global and led by Genomics England led– created to better understand and fill the current data gap with targeted, large-scale sequencing will be essential to fulfil these ambitions moving forward.
Data and software availability
The release of this blog and all its analyses coincides with the release of an analysis tool developed by the Diverse Data initiative.
gel-rd-glm is a software for modelling differences in rare disease diagnostic yield and variant tiering resulting from the 100,000 Genomes Project and is available to use by researchers with access to the Genomics England Research Environment.
Access to 100,000 Genomes Project data can be obtained by following the guidance outlined here. Please contact Sam Tallman at for any and all questions about this work and the uses of this analysis tool!
Note, a scientific paper with full details of these results (and more!) will be coming soon. We are also conducting the same analysis into participants with cancer, so watch this space!