Detecting short tandem repeats from whole genome sequencing
By Mark Doherty and Kevin Savage onGenomic data scientists, Mark Doherty and Kevin Savage, discuss how features of the genome known as ‘short tandem repeats’ are an important source of genetic variation, and how detecting them with new efficient methods is bringing more genetic diagnoses to patients.
What are short tandem repeats?
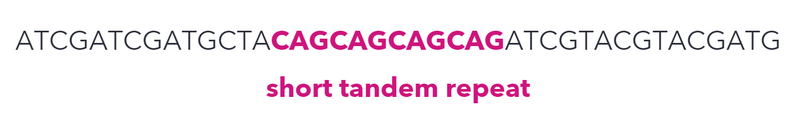
Short tandem repeats (STRs) are sections of the genome that contain several repeats of a certain sequence of bases.
Our genomic code is made up of four bases: adenine (A), thymine (T), cytosine (C) and guanine (G). When a sequence or ‘motif’ of these bases is repeated, we call this an STR. In the example below, we show an STR comprised of a trinucleotide sequence (‘CAG’) that has 4 repeats.
STRs make up about 3% of our genome, impacting both coding and non-coding regions. A key characteristic of STRs is that they are less stable during DNA replication. This means that individuals may inherit an STR at a given locus that is longer or shorter than is present in their parents.
When certain STRs become larger, termed an STR expansion, they can cause rare conditions. STR expansions that impact over 50 genes have been linked to various neurological disorders.
What are the characteristics of pathogenic STRs?
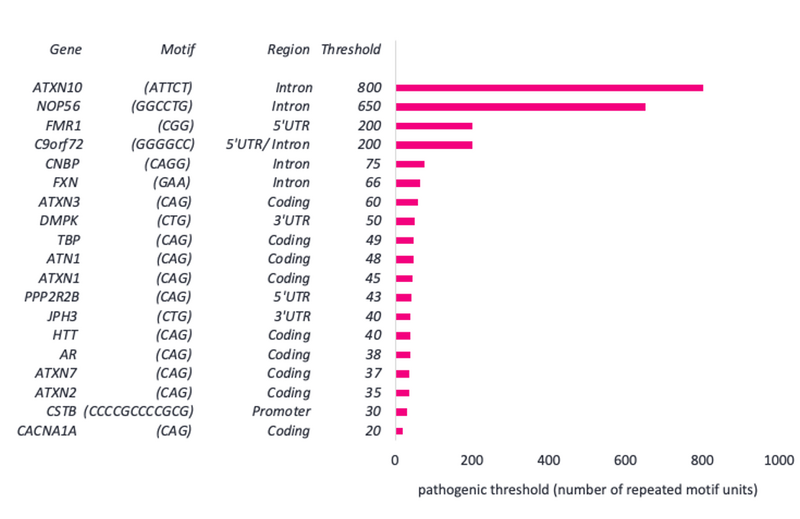
The features of disease-causing STRs that are present in PanelApp (a Genomics England database of genes that have been linked to disease) are displayed below.
We can see that STRs differ in their repeat motif and their location within a gene. They can also vary hugely in their pathogenic threshold (the number of repeat motif units which are required to cause disease).
We see below that the CAG motif in CACNA1A requires just 20 or more repeats to cause hereditary ataxia. However, the ATTCT motif in ATXN10 requires 800 or more repeats to cause early-onset dementia.
Disease-causing STRs also differ in their pathogenic mechanism. Some STRs, for example in the gene FMR1 which causes fragile X syndrome, are pathogenic via a loss-of-function mechanism called hypermethylation. This occurs when tags that instruct a cell to ignore sections of DNA increase in number and cause a gene to be silenced.
Other STRs are believed to be pathogenic through a variety of gain-of-function mechanisms. For example, protein misfolding leading to disrupted cellular machinery, occurring in the HTT gene which causes Huntington's disease. Some STRs, such as in the DMPK gene which causes myotonic dystrophy, form stable secondary structures which sequester proteins that are needed elsewhere.
Another pathogenic mechanism occurs in the gene C9orf72 which causes amyotrophic lateral sclerosis. Here, non-canonical translation result in dipeptide repeats, i.e., the formation of potentially problematic peptides without the need for normal genetic cues. These can then aggregate throughout the central nervous system.
How are STRs detected?
Routine approaches to detect many STRs have been polymerase chain reaction (PCR) and Southern blotting.
PCR can determine with high accuracy if the number of motif units is above a certain threshold, and can often be used to accurately measure the number of motif units that are present at a specific locus. Southern blotting can also detect the presence of large expansions above a certain threshold.
While both have become standard-of-care techniques in clinical laboratories, they are both laborious, time consuming, and only test for one specified locus at a time.
At Genomics England, we use high-throughput whole genome sequencing (WGS) technology. The general process of this technique is:
(1) DNA is first broken up into small fragments.
(2) The order of bases (sequence) is determined for a set number of bases at either end of each small fragment (e.g., 150 bases), this forms a ‘pair’ of sequencing reads.
(3) Computational methods are used to stitch these short, sequenced, fragments back together and determine the larger sequence.
The main advantage of WGS is that it has made it much faster and cheaper to sequence an individual’s DNA and assess multiple types of variation in their genome.
However, though WGS is a well-established means of identifying small variants in the genome, traditionally it has been difficult to accurately measure STRs from WGS data.
When the genome is broken into small fragments for sequencing, often these fragments are shorter than the length of an expanded STR. Moreover, STR-derived fragments are often highly repetitive, making it difficult to stitch them together in the correct order or location in the genome.
Recently developed tools, such as ExpansionHunter, are designed to genotype STRs from WGS data. It uses multiple features of WGS reads to determine the length of an STR.
The figures below display the WGS features that ExpansionHunter uses to determine the length of a repeat from WGS data. Each figure shows a pair of DNA sequencing reads (blue), at either end of a DNA fragment (black), that contains an STR (pink).

In some cases (as above), an STR will be fully enclosed within a read and can be measured directly. The genotyping of these STRs will be most accurate as the length can be directly determined from the read.
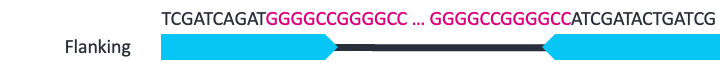
A pair of reads may flank a medium length STR, knowing how far apart this pair of reads should be, enables us to determine how long the STR is.

Alternatively, one read in a pair may be ‘anchored’ while the other read is a fully in-repeat read (IRR).

The final piece of evidence that ExpansionHunter uses to determine the length of a repeat, is if a pair of reads are composed entirely of the repeat sequence. The number of these IRR pairs that are observed can help identify medium length repeats from long repeats.
STRs that rely on IRRs for genotyping provide less accurate results than those which use enclosed and flanking reads; however, they can typically identify large expansions from unexpanded STRs.
The advantages of using ExpansionHunter are that it can be used directly with WGS data. This means that apart from computing time, there are no additional costs. Additionally, multiple STRs can be genotyped at the same time, meaning that several genetic diagnoses can be tested for in one step.
It is important that STRs predicted to be expanded by ExpansionHunter are still validated by PCR. However, previous work by Genomics England and global collaborators has shown that ExpansionHunter has 97·3% sensitivity (95% CI 94·2-99·0) and 99·6% specificity (99·1-99·9) relative to PCR test results when identifying pathogenic expansions in 13 disease associated loci.
This high sensitivity means that for the majority of loci, a case that is predicted to be unexpanded does not require confirmatory PCR validation. This would significantly reduce the testing burden for clinical labs.
Validating ExpansionHunter for use in the rare disease pipeline
ExpansionHunter v2.5.6 is used in the current Genomics England pipeline to enable us to provide genotype results for 19 loci; all of which can be found on PanelApp.
Before integrating software into the rare disease pipeline, we perform validation to ensure that results remain consistent with standard-of-care (in this case, PCR) approaches.
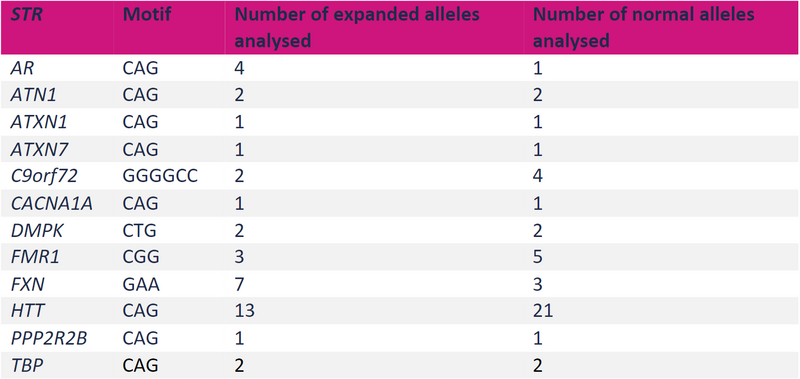
For example, comparing against standard-of-care datasets for both normal and expanded STRs at 13 loci (see table above) has demonstrated that the overall sensitivity of the Rare Disease Pipeline for detecting STR expansions is 96.0% (95% credible intervals 89.6% - 99.9%). The overall precision for STR detection was 98.6% (95% credible intervals 95.2% - 100%) and specificity was 98.8% (95% credible intervals 95.2 - 100%).
Taken together, these results indicate a very high rate of finding the true expanded loci, and a very low rate of false positives from WGS datasets.
Retrospective analysis of WGS datasets
Some patients referred for WGS at Genomics England have previously received PCR testing for a specific STR.
From this data, we have genotypes identified for 1178 STR alleles to assess concordance between the techniques. Overall, we see high levels of concordance between WGS genotyped STRs and PCR approaches (95% within ±2 repeat motif counts) (see figure below).
However, we do observe significant and consistent differences at some specific STR loci. For example, DMPK demonstrates identical repeat counts irrespective of the technique used (n=38, PCR and WGS).
Conversely, there are more discrepancies between PCR and WGS results at the FXN loci, where we observe a significant number of outliers (although 95% of events are still within ±3 repeat motif counts).
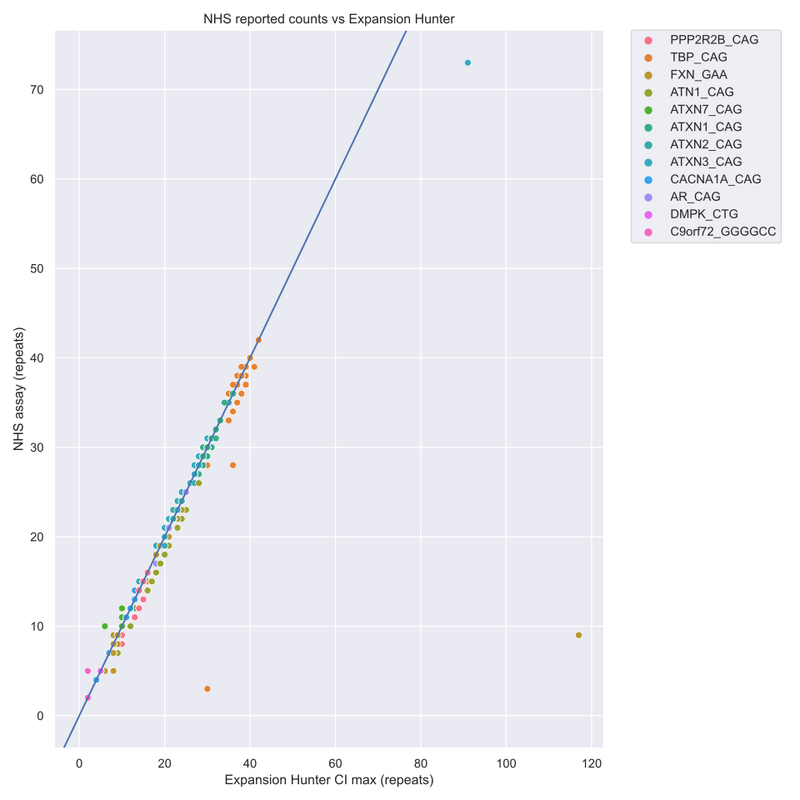
The graph above highlights that large discrepancies between standard-of-care PCR tests and ExpansionHunter results are attributable to ExpansionHunter overestimating allele length, while underestimates are small with high concordance between PCR measurements and ExpansionHunter predictions. This indicates that samples are predicted to be unexpanded with a high degree of confidence and do not require confirmatory PCR.
It is likely that the size and exact composition of the STR event has an impact on the capability of WGS to identify it accurately. Extensive investigations are essential for each relevant STR locus before incorporation into the rare disease bioinformatics pipeline.
At Genomics England, we are currently using similar methodologies to those described above, to assess the advantages and disadvantages of upgrading our pipelines to use ExpansionHunter v5.
To end...
At Genomics England, we are using WGS data with cutting-edge bioinformatics techniques to help provide genetic answers to patients.
Not only does this approach benefit clinical labs by minimising costly and time-consuming methods, but there is also great benefit for patients, as testing for multiple STRs at once can lead to a new, unexpected genetic diagnosis.
To read more about the research we do at Genomics England, check out our other bioinformatics blogs.