Improving sensitivity of rare disease diagnostic testing by prioritising known pathogenic variants
By Liam Abrahams onIn this blog piece, our Genomic Data Scientist, Liam Abrahams, discusses how the incorporation of free public archive, ClinVar (which reports the relationships between genetic variations and clinical phenotypes), will improve the sensitivity of our pipelines, and how this should provide additional diagnoses to patients.
Nucleotides are the building blocks of our DNA. Out of the >3 billion nucleotides in our genome, approximately 5-6 million of them are different from the human genome reference sequence. One of the challenges faced by whole genome sequencing (WGS) pipelines, such as the rare disease pipeline at Genomic England, is how to triage these variants down to a manageable number that could be clinically relevant.
Triaging variants during rare disease tiering
Our previous blog post provided an overview of the rare disease tiering process for triaging small variants (loosely defined as those that impact <50 nucleotides). A key consideration in the development of these bioinformatics approaches is how to best balance sensitivity (ability to detect all genetic diagnoses) with specificity (number of variants clinical teams must assess). In order to limit the number of variants that are assessed by clinical scientists, we ask two direct questions during rare disease tiering. These are:
- “Is the variant rare?” – assuming that common variants are less likely to be causative of rare disorders
- “Is the variant protein-altering?” – assuming variants that directly impact proteins are the mostly likely to be pathogenic
Whilst this approach can reduce the variant burden for clinical scientists - for example, ~98% of the genome does not encode protein, and variants in these regions are excluded from tiering – it is also limited by the assumptions and excludes variants that are disease-causing but do not fit these criteria. See another previous blog for examples of non-coding variants that cause rare disease, and some examples below:
Example 1: Intronic variant in the non-coding region
- chr7:117639961:C>T: an intronic variant in the CFTR gene, (a gene associated with cystic fibrosis), has disease associations and is known to alter splicing patterns (see ClinVar record). As this variant occurs in the non-coding region of CFTR, the tiering rules mean this variant would not be prioritised.
Example 2: A variant common in a sub-population
- chr1:94008251:C>T: a missense variant in the ABCA4 gene. Variants in ABCA4 are often associated with eye conditions (see this review for an overview) such as retinal dystrophy, macular degeneration and Stargardt disease (rs1658918693, rs61750645, rs112005636 are a few examples). However, in the gnomAD exomes Ashkenazi Jewish population, chr1:94008251:C>T occurs at a frequency of 0.0232 - exceeding all thresholds applied in the rare disease tiering pipeline (0.001 for autosomal dominant inheritance and 0.01 for autosomal recessive inheritance). This variant is a typical example of a founder variant (a variant with a higher frequency in one sub-population) – that would not be prioritised by rare disease tiering.
Using public datasets helps to prioritise known pathogenic variants that do not fit tiering criteria
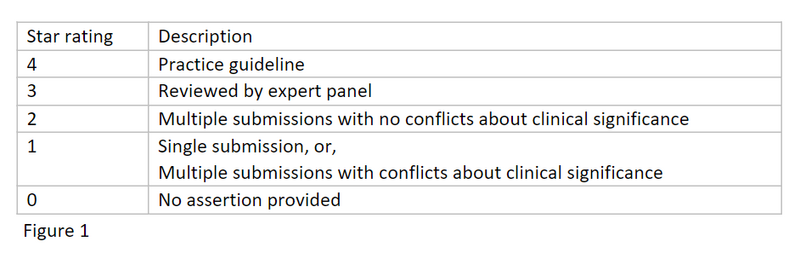
One approach to overcome these known limitations is to make use of public datasets to enhance and improve the triaging process. ClinVar is a free public archive reporting the relationships between genetic variations and clinical phenotypes. ClinVar also collects supporting evidence for a variant’s classification and aggregates independent classifications of a variant together into a star rating system, as detailed below. Our aim is to leverage this curated data in order to highlight known disease-causing variants in participants that would normally be excluded by rare disease tiering assumptions.
Can the use of ClinVar enable the discovery of more diagnoses?
We searched for 1-star or higher pathogenic/likely pathogenic ClinVar variants in probands (the participant in which we are trying to identify a genetic cause) from 29,880 families in the 100,000 Genomes Project (for conflicting 1-star interpretations where at least one assertion had to be pathogenic/likely pathogenic). Variants were filtered further so that they were in a green gene in one of the PanelApp panels applied to the participant, we could then restrict our analysis to participants without a diagnosis.
Using this dataset, we found 167 different pathogenic/likely pathogenic ClinVar variants that had previously been filtered out by the pipeline in 2,012 separate probands:
- 80 variants were filtered out because they were too common
- 83 variants were filtered out because they didn’t have a consequence type required (i.e., weren’t protein altering or impacting canonical splice sites)
- 4 variants failed both filters
The probands whose genomes contained these variants were passed to our clinical and diagnostic discovery teams for inspection. This led to the identification of 269 probands where the identified variant could lead to a diagnosis that wasn’t achieved through the default tiering methods:
- For 99 probands, this represents a new diagnosis
- For 140 probands, the variant is undergoing further review
- For 30 probands the variant is part of a diagnosis, but it had already been found through an alternative method
This work is still ongoing, and the diagnostic discovery team are still finding new diagnoses both with this data and for other reasons!
Incorporating known pathogenic variants in the routine analysis pipeline
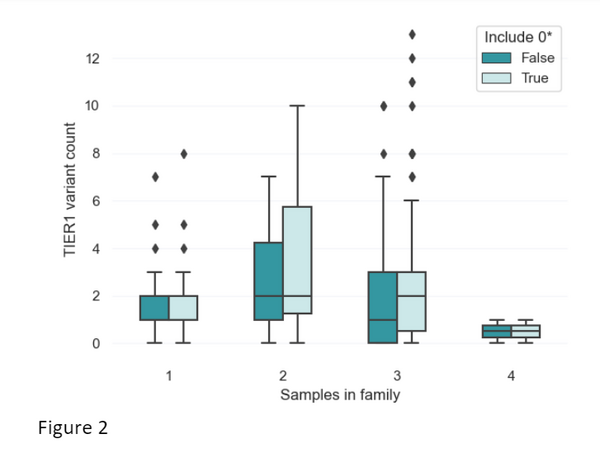
As is shown above, ClinVar data provides great utility in helping provide potential diagnoses for patients. We have therefore developed an approach to include ClinVar data in rare disease tiering. Before incorporating this, we wanted to assess the impact of the modified tiering approach on the number of variants that are returned to clinical scientists. To do this, we selected 200 random NHS Genomic Medicine Service cases with varying family structures: 37 singletons (just the participant), 10 families with two participants sequenced, 151 families with three participants sequenced (quite often the proband along with their mother and father), and one family with four people sequenced). Across these different family structures, we assessed the difference in the number of variants prioritised with and without the inclusion of ClinVar variants using: (a) 0-stars and above, or (b) variants with only 1-star and above with at least one pathogenic assertion.
We assessed the most relaxed criteria that could be applied with the ClinVar data (0-star variants and above). For trios (the typical family structure), we find the mean number of TIER1 variants per case increases from 1.702 per case to 2.212. For singletons, the mean number of TIER1 variants increases from 1.595 to 1.649. In figure 2, we can also see that the distribution in the number of TIER1 variants does not change drastically after incorporation of ClinVar.
This data gives us some confidence that the incorporation of ClinVar variants into tiering will improve our sensitivity of the pipelines. This should provide additional diagnoses without significantly increasing the workload for clinicians and clinical scientists.
Conclusions and further directions
The ability to pinpoint pathogenic variants amongst the millions detected per human genome is a considerable challenge. It balances sensitivity (ability to detect all genetic diagnoses) with specificity (number of variants clinical teams must assess). We have shown that, by incorporating ClinVar in our pipeline, we can increase the number of diagnoses identified without large increases to the burden of variant analysis.
We will continue to incorporate ClinVar updates into tiering to ensure that we can help to provide more diagnoses to patients. Similarly, we will also be prioritising diagnostic pathogenic/likely pathogenic variants from previous 100,000 Genomes Project and NHS Genomic Medicine Service cases in tiering. This should enable us to take advantage and learn from previous diagnoses in future prioritisation.