Inclusive ancestry group assignment in genetics research
By Samuel Tallman onAssigning sequenced individuals to genetically defined ancestry groups (GDAGs)* for various downstream analyses is widespread in human genetics.
Most approaches for assigning participants to GDAGs use the same basic framework. They compare a person’s genetic variants (often many tens of thousands) to those same variants genotyped in other people from ‘reference populations’.
This assessment of genetic similarity is used to assign individuals into groups. These groups can then be independently analysed or compared.
In this blog, we review an approach commonly used to assign participants into GDAGs using genomic data from the 100,000 Genomes Project. We touch upon some practical limitations, and explain how a more inclusive approach based on the UK population can lead to new scientific insights.
Group assignment using the 1,000 Genomes Project as a reference cohort
The 1,000 Genomes Project (1000G) – not to be confused with the 100,000 Genomes Project – is widely used as reference cohort in human genomics research.
It contains around 2,500 contemporary human genomes, and represents people living across many parts of the world. These genomes are often categorised into 5 continental super populations: African (AFR), Admixed American (AMR), East Asian (EAS), European (EUR), South Asian (SAS).
Genetic similarity to super populations in the 1000G is the approach most commonly used by Genomics England researchers to assign participants into GDAGs. For example, Wei et al. 2022, Kousathanas et al. 2022, or my own work on rare disease candidate variant prioritisation in the 100,000 Genomes Project, all use this technique.
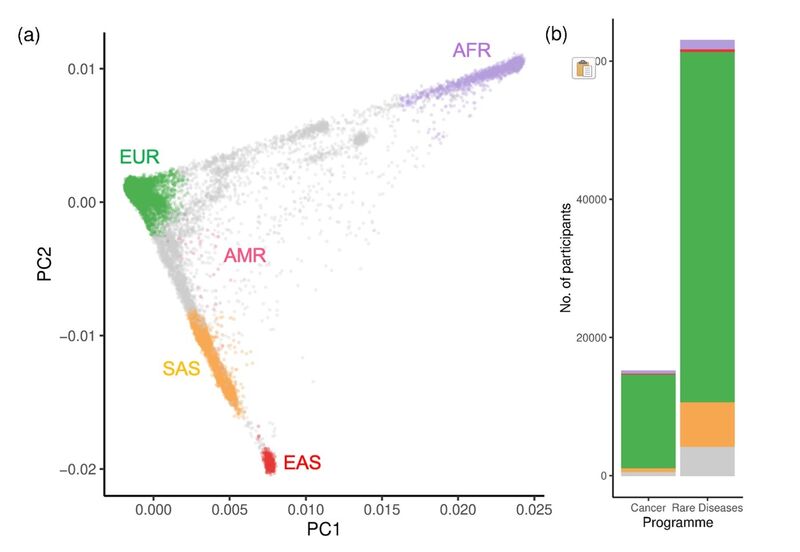
Figure 1. 100,000 Genomes Project participants assigned to groups using the 1000G as a reference cohort. (a) Principal Components Analysis (PCA) with 78,195 100,000 Genomes Project participants (among the aggregate V2 release 17) assigned to GDAGs based on their genetic similarity to 1000G reference super populations using the PCA projection method outlined in Prive et al. 2022 (b) with a selected threshold stringency of FST < 0.002. (b) Number of individuals assigned to each GDAG by Genomics England programme (Cancer or Rare Diseases). Individuals without an assignment are shown in grey. EUR = European, AMR = Admixed American, SAS = South Asian, EAS = East Asian, AFR = African.
Figure 1 shows a breakdown of participants from the 100,000 Genomes Project that could be confidently assigned** to GDAGs. They are labelled according to one of five super populations, using the 1000G as a reference cohort.
As expected from this UK-based project, EUR assigned participants make up around 82% of sequenced participants, with members of other assigned groups ranging from 9% (SAS) to 0.04% (AMR) of the dataset.
Looking closer, however, we see that 6% (n = 4,498) of participants from the 100,000 Genomes Project remain unassigned using this approach. That is, they don’t appear ‘genetically similar’ enough to any of the five super populations, and so cannot be confidently labelled.
Unfortunately, this means they are more likely to be excluded from downstream research they have consented to be involved in – including research into the 100,000 Genomes Project dataset.
Concerns surrounding not fully using data from diverse and under-represented populations are well documented. They have led to the systematic exclusion of many participants from analyses of large genetic datasets, such as the UK Biobank (where the 1000G five continental super population model was typically employed).
Group assignment using the UK Biobank as a reference cohort
There are multiple reasons why individuals can end up not being assigned to a GDAG.
The first is inherent to all reference-based group assignment approaches. That is, individuals with genetic ancestors best represented by multiple reference populations, will not be confidently assigned in many cases. For example, somebody with a European mother and an East Asian father.
Even in instances where assigning individuals to single, discrete GDAGs is still useful or necessary, another practical limitation remains: the availability and selection of reference populations.
While widely used, the 1000G is not representative of global genetic diversity. This means that participants from the 100,000 Genomes Project with recent genetic ancestors that fall outside of these five broad, continental regions, are also unlikely to be confidently assigned using the 1000G as a reference cohort.
This issue of representativeness can be demonstrated using an alternative reference cohort. Using data from around half a million people in the UK Biobank, Florian Privé described an expanded set of reference populations defined by an individual’s country-of-birth, self-reported ethnicity, and crucially – their genetic similarity to one another.
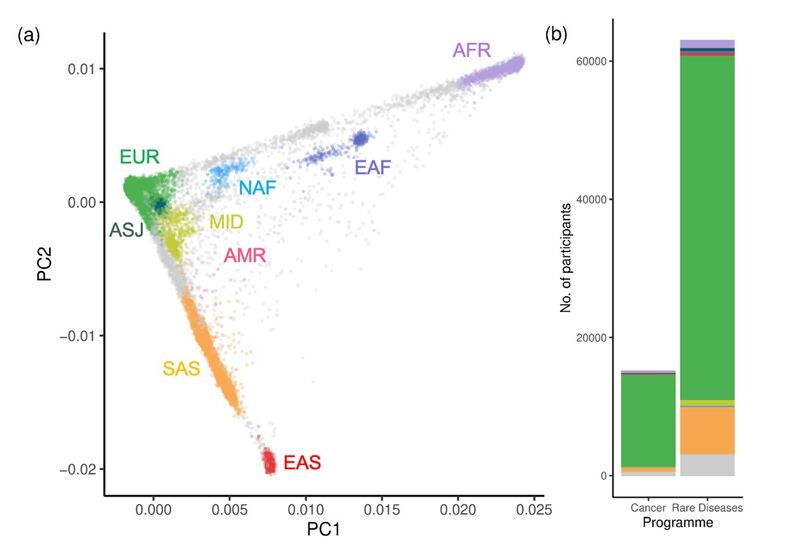
Figure 2. 100,000 Genomes Project participants assigned to groups using the UK Biobank as a reference cohort. (a) Principal Components Analysis (PCA) with 78,195 100,000 Genomes Project participants (among the aggregate V2 release 17) assigned to GDAGs based on their genetic similarity to 21 populations curated from the UK Biobank (Prive et al. 2022) (a) using the PCA projection method outlined in Prive et al. 2022 (b) with a selected threshold stringency of FST < 0.002. These 21 reference populations were subsequently merged into 9 continental super populations (b) Number of individuals assigned to each GDAG by Genomics England programme (Cancer or Rare Diseases). Individuals without an assignment are shown in grey. EUR = European, ASJ = Ashkenazi, SAS = South Asian, EAS = East Asian, AFR = African (Niger-Congo), EAF = East African, NAF = North African, MID = Middle Eastern.
Figure 2 shows GDAG assignments from the 100,000 Genomes Project, generated using the expanded set of reference populations from the UK Biobank.
Using this updated approach, 1,773 individuals in the 100,000 Genomes Project that were previously unassigned using the 1000G (Figure 2), can now be assigned using the same stringency threshold.
Notably, 72% of these newly assigned individuals are assigned to either the East Africa (EAF), Middle East (MID), or North Africa (NAF) groups. All of which have no close genetic analogue among the 1000G reference populations.
New insights gained from a more inclusive group assignment approach
We can use an example from my own work on rare condition diagnosis to demonstrate some advantages of taking a more inclusive approach to describing genetic diversity.
As part of my analysis, I looked for differences in the number of prioritised (or “tiered”) candidate pathogenic variants in probands with rare conditions, each of whom were assigned to a super population in the 1000G. I found that EUR assigned probands often had fewer reported candidate variants than those assigned any other group.
I then discussed how variant filtering based on observed allele frequencies from imbalanced genomic datasets can contribute to any differences.
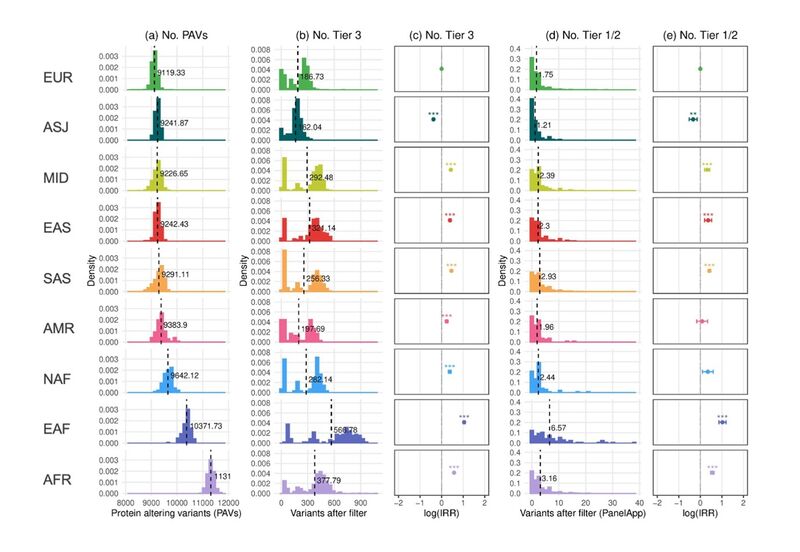
Figure 3. Numbers of tiered variants in 100,000 Genomes Project rare disease probands by assigned GDAG using the UK Biobank as a reference cohort. (a) Histogram showing the numbers of Protein Altering Variants (PAVs) per proband by assigned GDAG. The dotted lines represent the mean number of variants in each assigned group. (b) As in (a) but for PAVs labelled as Tier 3. (c) Incidence Risk Ratio (IRR) of observing a Tier 3 variant in each assigned group relative to EUR assigned probands. IRR is calculated using multivariate negative binomial regression with age, sex, family group type, penetrance, PanelApp panel applied, and cumulative ROH > 2Mb as covariates, including an interaction term between family group type and penetrance. (c) As in (b) but for PAVs labelled as Tier 1 or Tier 2. (d) As in (c) but for PAVs labelled as Tier 1 or 2. *** p < 0.001, ** 0.001 > p < 0.01. p values were adjusted using Bonferroni correction. See this blog post by Kevin Savage for more information on variant tiering.
In Figure 3, I replicated this analysis using GDAG assignments. This was based on a participant’s genetic similarity to the expanded selection of reference populations generated from the UK Biobank.
Using these updated GDAGs, several new insights emerge. For example, we can now see that probands in the newly assigned EAF group have (on average) considerably more candidate variants within the applied PanelApp gene panel. They also reported to clinicians (Tier 1 or 2) an average of 2.9 times more than EUR assigned probands, and 1.8 times more than AFR assigned probands (Figure 3d/e).
A similar pattern is observed among Tier 3 candidate variants that are not observed within the applied PanelApp gene panel (Figure 3b/c). This suggests that observations are due to genetic divergence of EAF assigned probands from populations used for allele frequency estimation, and not, for example, gene panel ascertainment.
This makes sense, as estimates have indicated that lineages ancestral to East African and West African populations separated tens of thousands of years ago.
Many East African populations are therefore highly differentiated from those present in the African (AFR) reference datasets used for allele frequency filtration. Such reference datasets are instead made up almost entirely of West Africans and African Americans (see gnomAD v3.1).
As a result, variants common specifically in East African populations will appear to be superficially rare. Probands genetically similar to these East African populations will have an increased number of variants falsely reported as good pathogenic candidates.
Indeed, these results highlight the continued need for under-represented communities to be sequenced and included in available allele frequency catalogues. They suggest that East African communities should be considered as a priority for future research and engagement.
Final thoughts
These insights show that a more inclusive approach to describing the genetic diversity of 100,000 Genomes Project participants has the potential to inform clinical practice in diagnosing rare conditions.
This is particularly significant for individuals from historically under-researched groups.
The blog here demonstrates this by simply increasing diversity in reference populations to assign individuals to GDAGs (Figure 2). By doing this, we could identify participants genetically similar to a greater diversity of worldwide populations, enabling more participants to be included in downstream research.
Researchers can use this information in their own work by accessing the National Genomic Research Library (NGRL). Here, all of the GDAG assignments (and accompanying statistics) generated using the expanded UK Biobank reference cohort (Figure 2/3) have been made available for all participants.
Importantly, while use of this expanded reference cohort offers a simple, accessible means of improving GDAG assignment, even this approach is insufficient. To truly capture the underlying complexities of human genetic ancestry, we often need to go beyond broad continental groupings.
This could allow us to describe genetic structure at a finer scale, or indeed, challenge the need for single discrete groups as reliable proxies for genetic ancestry in the first place.
To read wider discussions surrounding this topic, see the Reading List below. You can also read about other research in the field of genomics by checking out our bioinformatics or research blogs.
Data availability
Documentation on how to use and access updated GDAG information for all participants in the NGRL for researchers with access to the Genomics England Research Environment can be found in our research documents area.
Footnotes
* We use the term “genetically defined ancestry group (GDAG)” here, whilst noting that assigning individuals to groups in the manner described above is simply a measure of their genetic similarity to a given reference group. Such group labels do not precisely nor completely describe a participant’s genetic ancestry.
** Confidence as used here refers the maximum allowable genetic distance between a target individual and a given reference population to be assigned as such. In this blog post - as in Prive et al. 2022 - Euclidean distance on PC space between the reference population and the target individual is converted into an approximate FST, and a threshold of FST<0.002 is utilised as the minimum requirement to assign an individual to a given GDAG. The number of individuals assigned to a GDAG therefore has the potential to increase when a more lenient threshold is applied.